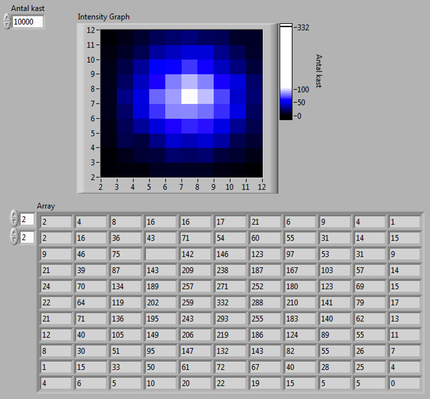
You now need to edit your ealier Dice Throws VI from the 1.5.1 - Dice Throws 2 exercise (saved as DiceThrows2.vi). You will need an additional 2 dice, which will specify the y-axis, so that you will have a 12 x 12 array with 2 dice forming the x-axis and 2 forming the y-axis. However, due to the 0-indexing, you must form a 13 x 13 array to hold the results. Your results will be plotted in a control array with 13x13 cells, and also in an intensity chart (see the Front Panel below).
Instructions:
- Open DiceThrows2.vi
- Save your VI as DiceThrows3.vi
- Expand the Initialize Array function with another row - notice what this dows to the Index and Replace Subset functions inside the loop. Connect the 13 with the new, bottom Dimension Size (this creates a 13 x 13 array).
- Delete the Waveform graph and make a control array instead (right-click the right shift register and choose Create -> Indicator. Remember to expand the array on the Front Panel. Set both indexes to 2 - this only shows the arrayet from 2,2 and leaves out the 0 and 1 cells).
- Create an Intensity Graph and format it like below. Wire it to the array output from the for loop.
- Save your VI